Troubleshooting choppy playback
If the preview stutters, freezes, or plays less smoothly than your finished export will, the Playback Statistics window shows you why. It’s a small floating readout of how well playback is keeping up — the frame rate you’re getting versus the one you should be getting, how many frames were skipped, and whether your computer is decoding the video on its graphics card (fast) or its processor (slower).
You don’t need it for everyday editing. Reach for it when playback feels wrong and you want to know what’s going on.
What’s in this guide
Section titled “What’s in this guide”- Open the Playback Statistics window
- What the numbers mean
- What healthy playback looks like
- If the preview can’t keep up
Open the Playback Statistics window
Section titled “Open the Playback Statistics window”Open the View menu and choose Playback Statistics.
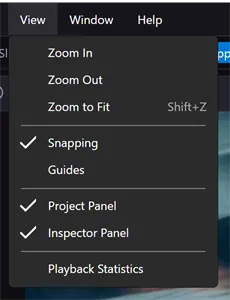
A small window appears near the top-right of the editor and stays on top while
you work. It doesn’t take over the keyboard — Space still plays and pauses
the preview — so you can leave it open, start playback, and watch the numbers
move.
To close it, click its ✕ or choose View ▸ Playback Statistics again.
Tip: Hover over any row in the window for a plain-language explanation of that number.
What the numbers mean
Section titled “What the numbers mean”Start playback and the readout updates about twice a second:
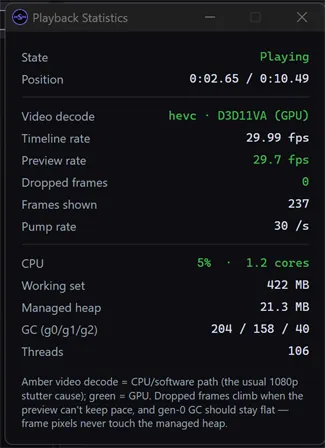
The top section describes playback itself:
| Row | What it tells you |
|---|---|
| State | Whether the preview is playing or paused. |
| Position | Where the playhead is, and the total length of what’s loaded. |
| Video decode | The video format being decoded, and whether it’s decoded on the GPU (your graphics card — fast) or in software on the CPU (slower). |
| Timeline rate | Your sequence’s frame rate — the rate the preview is trying to hit. |
| Preview rate | The frames actually shown per second, averaged over the last few seconds. |
| Dropped frames | Frames the preview had to skip to keep pace. The count is for the current play — it resets each time you press play. |
| Frames shown | Total frames displayed since playback started. |
| Pump rate | How many times per second the playback engine schedules a frame (it should sit near the timeline rate). |
The bottom section shows what the app is costing your computer: CPU use, memory (Working set), and a few technical rows (Managed heap, GC, Threads) that are mainly useful when reporting a performance problem.
Colors carry the verdict throughout: green is healthy, amber is worth a look, and red means playback is suffering right now.
Tip: The readout follows whichever preview is active — switch between the Program and Source tabs and it switches with you.
What healthy playback looks like
Section titled “What healthy playback looks like”During smooth playback you’ll see:
- Preview rate in green, sitting at (or within a frame of) the Timeline rate.
- Dropped frames at 0, in green.
- Video decode in green, naming your graphics card with (GPU).
When playback is paused, a preview rate near zero is normal — the preview only draws when something changes.
If the preview can’t keep up
Section titled “If the preview can’t keep up”A red Preview rate and a climbing Dropped frames count mean the preview is falling behind. The first thing to check is the Video decode row:
- Amber, ending in “software (CPU)” — the video is being decoded on the processor instead of the graphics card. This is the most common cause of stuttery 1080p playback, and it usually comes down to your graphics card or its driver not accelerating that video format. Updating the graphics driver is the first thing to try.
- Green (GPU) but still dropping frames — the machine is busy elsewhere. Check the CPU row; if it’s amber or red, closing other heavy programs gives the preview more headroom.
Dropped frames only ever count against the preview — your exported video is rendered separately and always comes out at full quality, even if playback stuttered while you edited.
Tip: The status bar at the bottom of the window shows a live frame rate too, and its state dot turns amber during playback whenever the software (CPU) decode path is in use — a quick hint that it’s worth opening Playback Statistics.
Related
Section titled “Related”- Play and preview your video — the playback controls themselves.
- A quick tour of the main screen — where the status bar’s live playback stats live.